Making the Reader THIRST! – Part 2
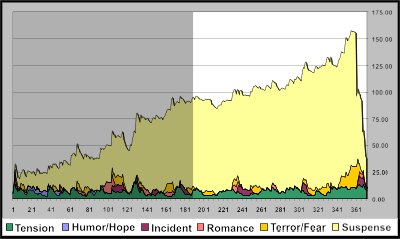
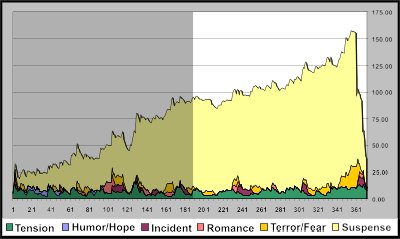
To commemorate my 50% milestone (be it ever so elusive), I am including the “graph” of my book using my THIRST™ methodology, which stands for:
T – Tension
H – Humor
I – Incident
R – Romance
S – Suspense
T – Terror/Fear
I have my plot in a spreadsheet with one row per scene and put numbers to all these values. All of them are between 1 and 10 (only allowed over that for special cases).
Suspense is handled a little bit different by a plus number and a minus number. This is because it builds as the story progresses and doesn’t go down until you answer nagging questions or the main character solves a long standing problems. In general, the movement is upwards.
The other areas besides suspense fade quickly in the mind of the reader and must be renewed with new tension / humor / incidents / romance / terror to keep the reader turning the pages.
So here is the graph of my first book, with the shaded area representing how far I am:

Eventually I’ll post the Excel spreadsheet so that if you are a writer you can download it and try it out on the plot of your book.

Note to all:
You can see on the graph how the yellow “Suspense” keeps rising as the book goes on. That represents the unanswered questions and unresolved issues that have built up, and are only resolved at the end.
The other THIRST areas all die off quickly and have to be renewed.